


Answer the following
- The stem and leaf diagram shows a sample of 50 scores in a boy’s golf tournament.
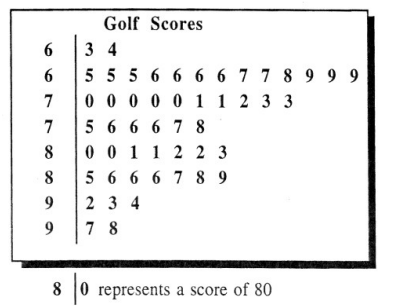
a) Write down the median golf score.
b) Calculate the interquartile range & semi-interquartile range for these scores
2. The histogram shows information about the time, t minutes, spent in a shop by each of 80 people.
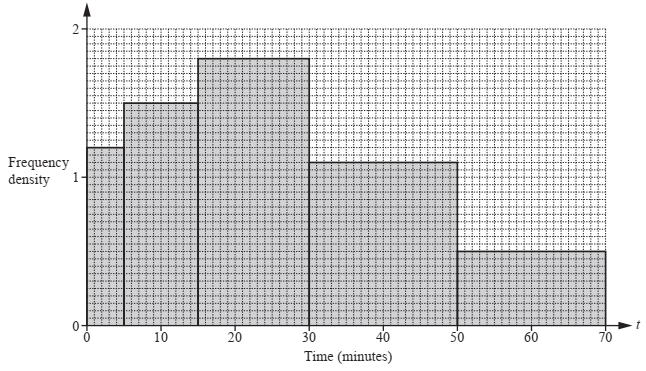
Complete the frequency table

3. The time taken for each of 120 students to complete a cooking challenge is shown in the table.

(i) Write down the modal time interval.
(ii) Calculate an estimate of the mean time.
(iii)Complete the cumulative frequency table.

(iv)On the grid, draw a cumulative frequency diagram to show this information.

(v) Find the median time. ......................................... min
(vi) Find the interquartile range. ......................................... min
(vii) Find the number of students who took more than 37 minutes to complete the cooking challenge
Downloaded from https://qusaistuition.blogspot.com
3. The time taken for each of 120 students to complete a cooking challenge is shown in the table.
(i) Write down the modal time interval.
(ii) Calculate an estimate of the mean time.
(iii)Complete the cumulative frequency table.
(iv)On the grid, draw a cumulative frequency diagram to show this information.
(v) Find the median time. ......................................... min
(vi) Find the interquartile range. ......................................... min
(vii) Find the number of students who took more than 37 minutes to complete the cooking challenge
Downloaded from https://qusaistuition.blogspot.com
0 comments:
Post a Comment