Popular Math Worksheets

Read More

IGCSE Mathematics Worksheet - Vectors-2

Read More

IGCSE Mathematics Worksheet-Variation

Read More

CBSE 10th-Mathematics worksheet-Trigonometry

Read More

IGCSE Mathematics - Percentages, Compound interest-Worksheet

Read More

CBSE 9th-Mathematics worksheet-Circles

Read More

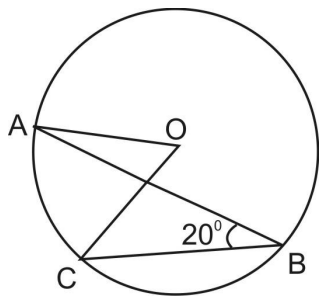
IGCSE Mathematics Worksheet- Circle Theorems

Read More

CBSE 8th-Mathematics worksheet-Comparing Quantities/Percentages-1

Read More

IGCSE Mathematics Worksheet- Graphs – Equations and Inequalities

Reviews

1 / 7
2 / 7
3 / 7
4 / 7
5 / 7
6 / 7
7 / 7

IGCSE Mathematics Past Papers Questions- Revision 2


Answer the following questions

1. 
 
Leave your comment
0 comments
Read More

IGCSE Mathematics Past Papers Questions- Revision 1


Answer the following questions
1. 


Leave your comment
0 comments
Read More

IGCSE Mathematics Worksheet - Venn Diagrams 2


Answer the following

1. Kim collected data on 40 people’s enjoyment of sport.

P is the set of people who play sports regularly, and 
W is the set of people who watch sports regularly. 
32 of the people she asked watch sports regularly. 
An incomplete Venn diagram for her data is shown below.
a) Complete the Venn diagram.
b) Work out P(W∪P) for someone picked at random.
c) Work out the probability that someone picked at random watches sports regularly but not play sports regularly

2. Sam asked 50 people which drinks they liked from tea, coffee and milk.


All 50 people like at least one of the drinks

19 people like all three drinks.

16 people like tea and coffee but do not like milk.

21 people like coffee and milk.

24 people like tea and milk.

40 people like coffee.

1 person likes only milk.

Sami selects at random one of the 50 people.

Draw a Venn Diagram and Work out the probability that this person likes tea.

3. Jack asked 60 people which sports they liked from rugby, football and cricket.

8 people like all three sports.

17 people like rugby and football.

13 people like football and cricket.

19 people like rugby and cricket.

35 people like football.

27 people like cricket

30 people like rugby.

Draw a Venn Diagram and Work out the probability that people liked neither rugby or football or cricket?

4. Jenny asked 80 people which sports they enjoy from Football, Hockey and Rugby.

Find the probability of:

(a) How many people enjoy all three sports?

(b) How many people enjoy football and hockey but not rugby?

(c) How many people enjoy football and rugby but not hockey?

(d) Work out which sport is enjoyed by the most number of people.

5. The Venn diagram shows information about the cars in a car park.
ξ = 150 cars in the car park
R = red cars
J = cars manufactured in Japan
A car is chosen at random.
Work out the probability that it is red.
 
Leave your comment
0 comments
Read More

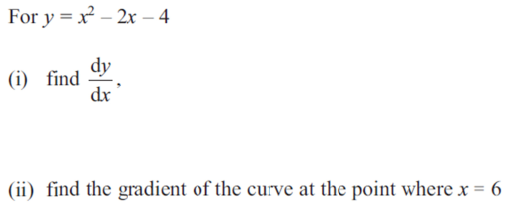
IGCSE Mathematics Worksheet - Differentiation (Calculus) -1


Answer the following
1.


      Find the maximum value of A.
 2.


  (c) State whether the turning point is a maximum or a minimum.
3.


4.


Find the coordinates of the point of y=f(x) where the gradient is 8
5.

Downloaded from https://qusaistuition.blogspot.com
Leave your comment
0 comments
Read More

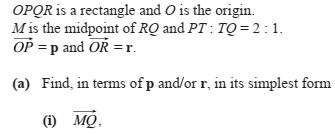
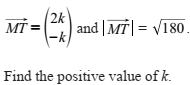
IGCSE Mathematics Worksheet - Vectors-2


Answer the following
1. 
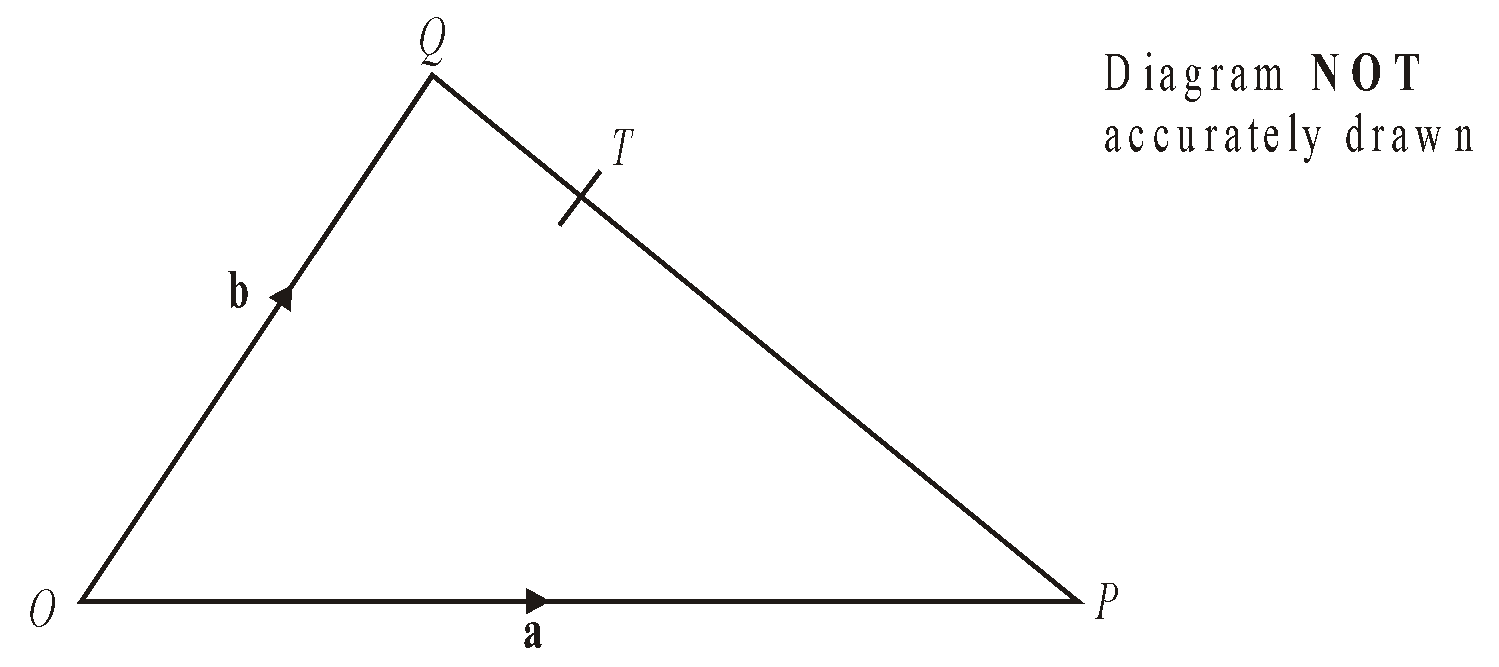
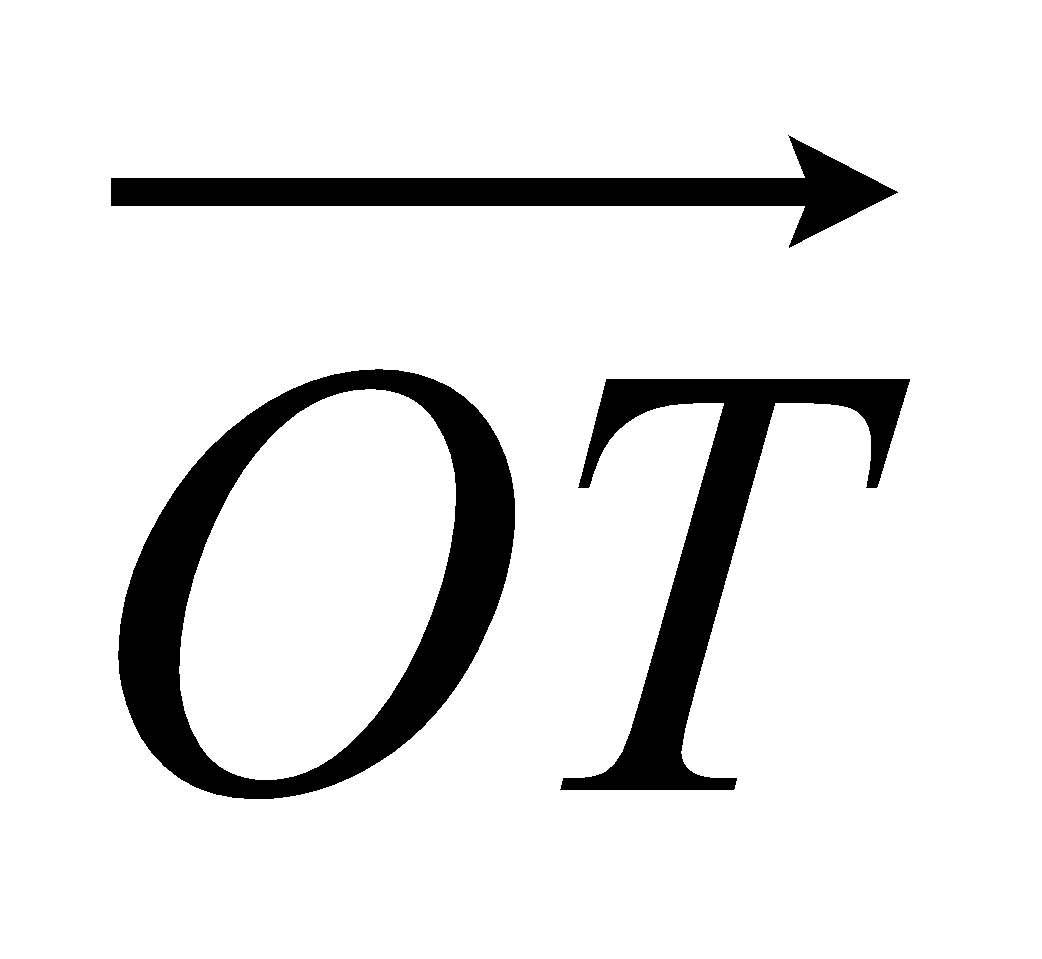
OPQ is a triangle. T is the point on PQ for which PT : TQ = 2 : 1.
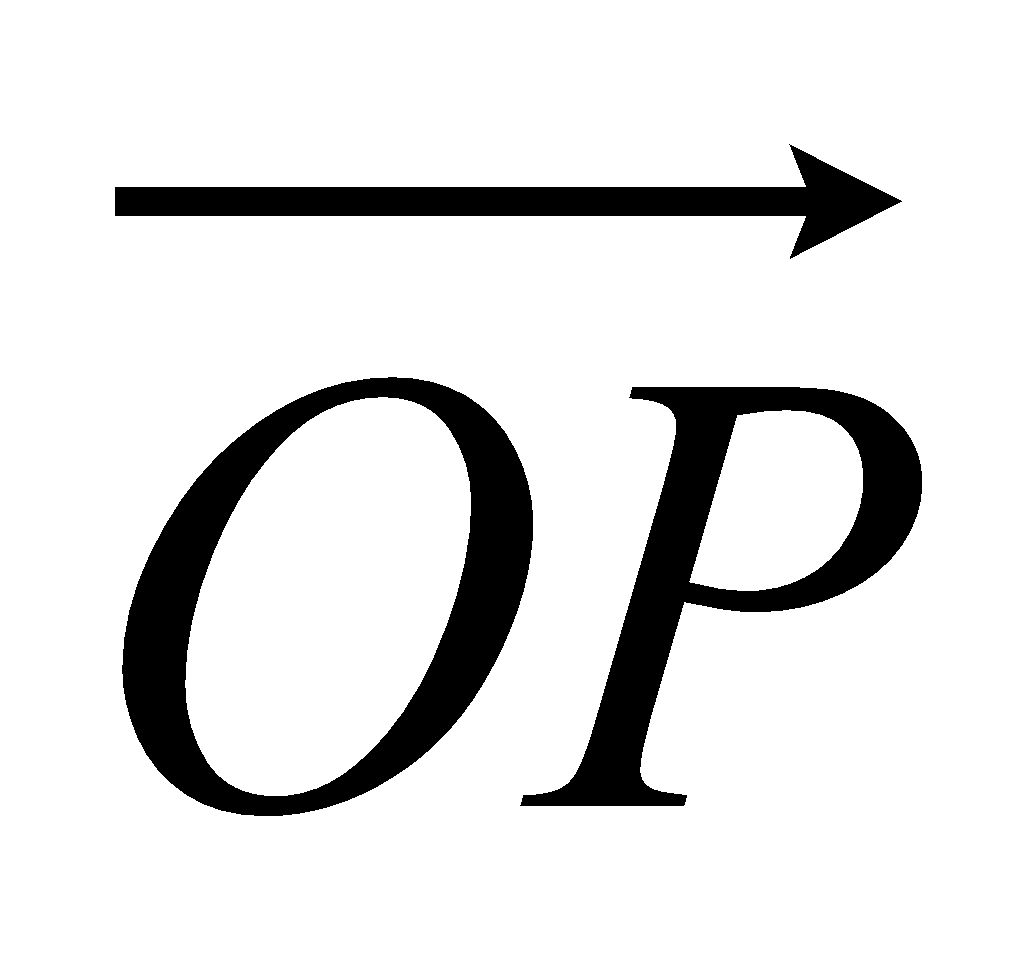
= a and = b.
(a) Write down, in terms of a and b, an expression for .

(b) Express in terms of a and b.  Give your answer in its simplest form.
2. 
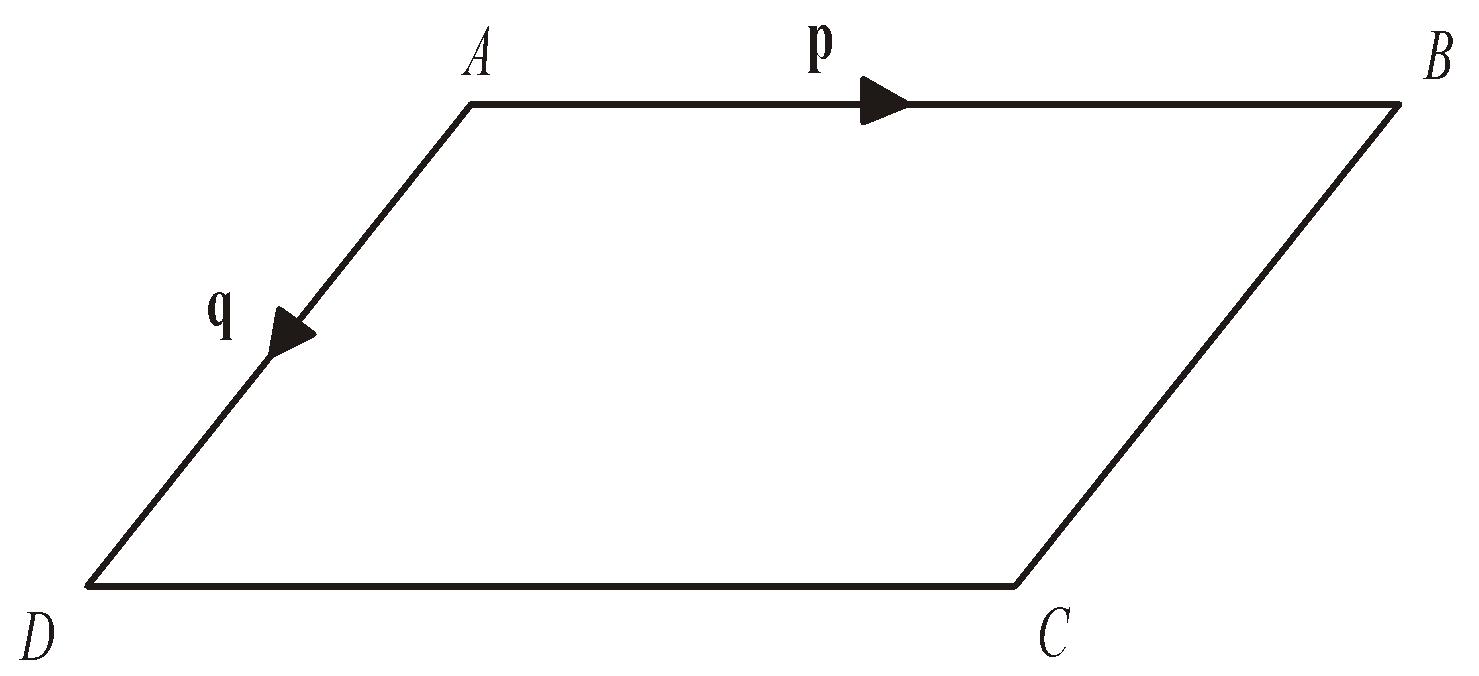
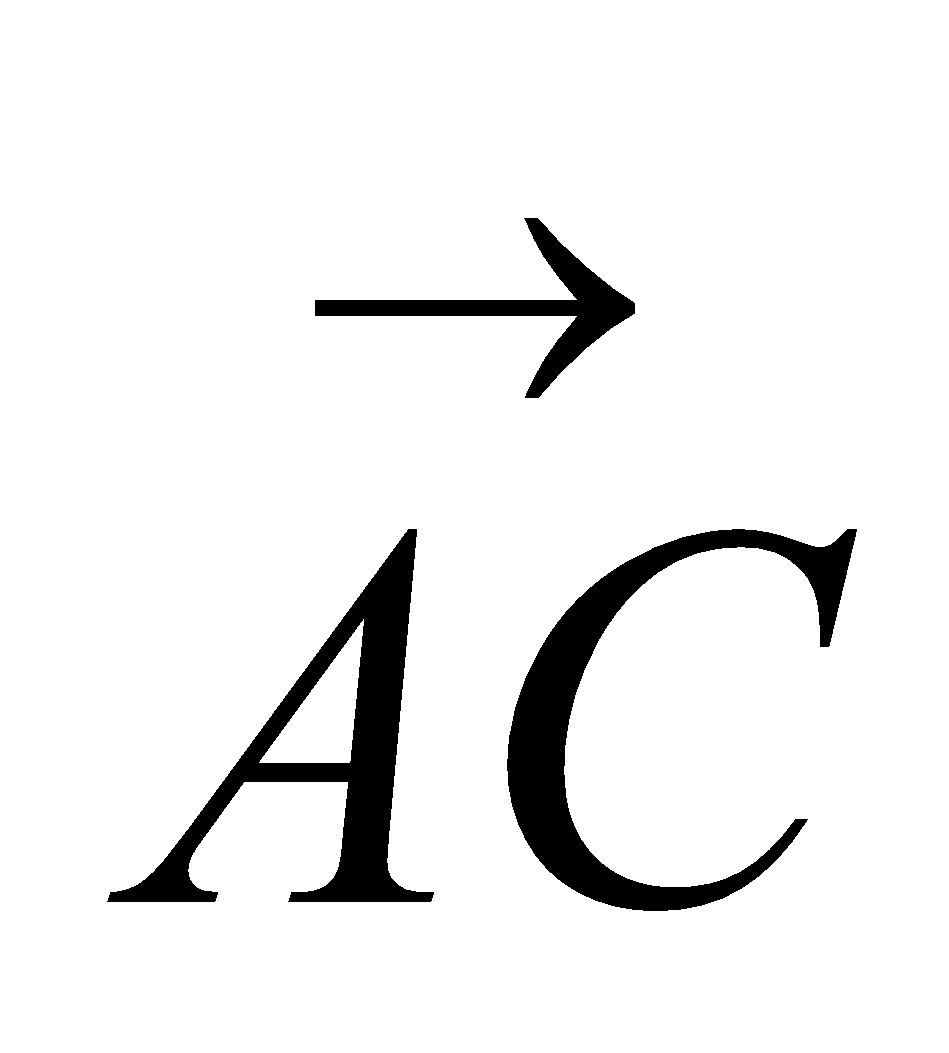
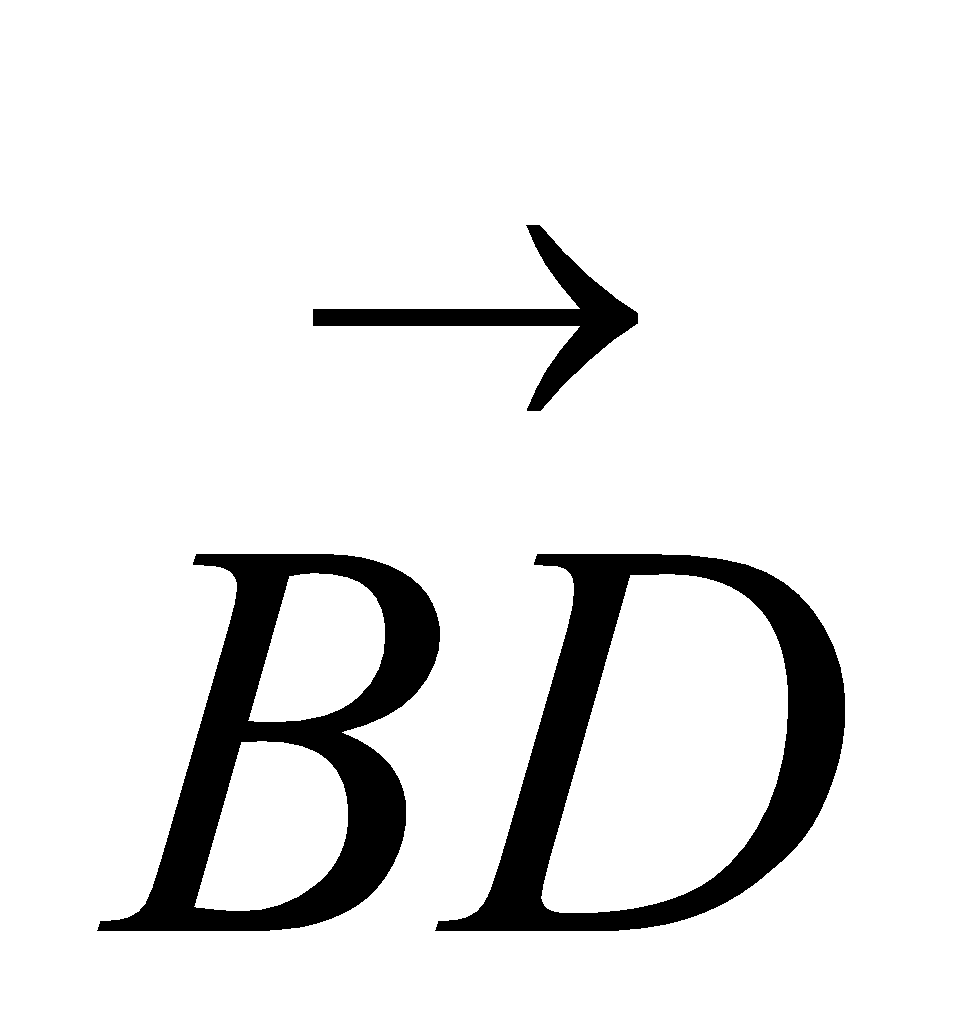
ABCD is a parallelogram. AB is parallel to DC. AD is parallel to BC. = p        = q
Express, in terms of p and q
(i)
(ii)
3.
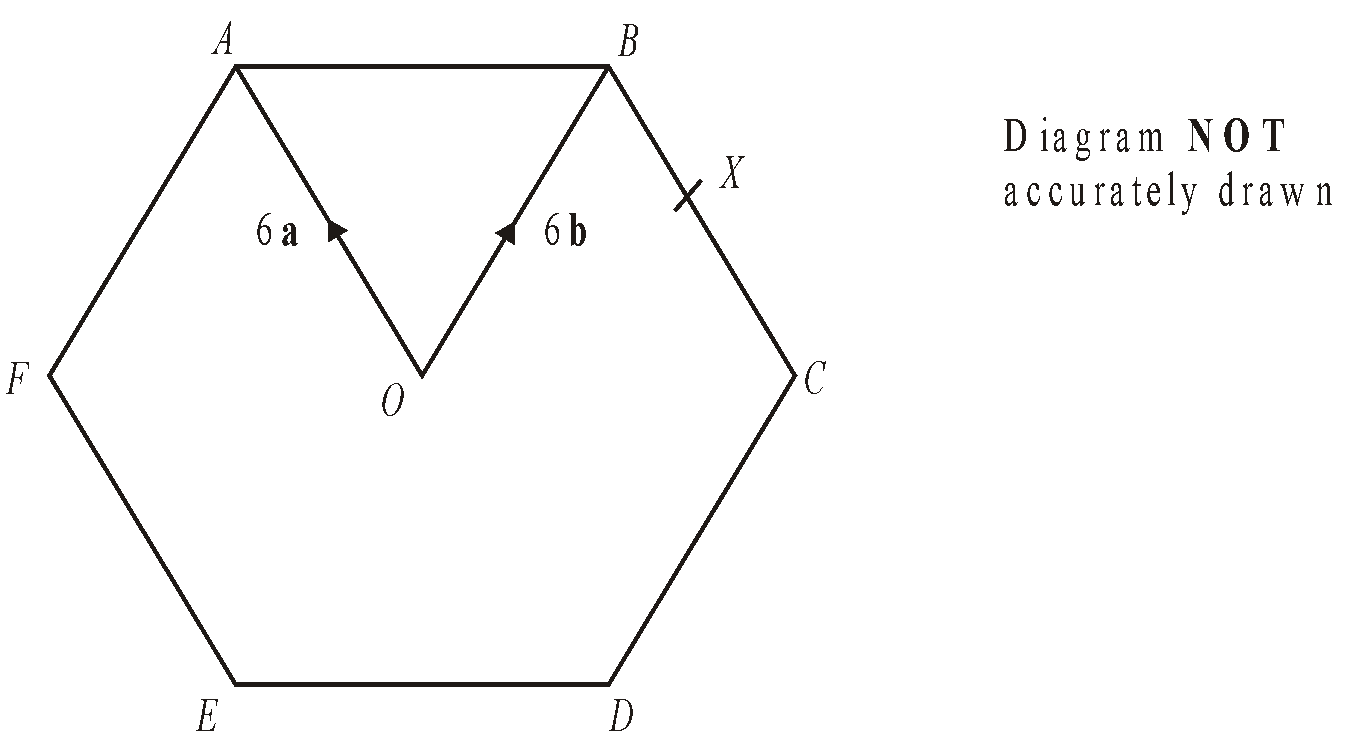
= 2b = 2a = 6a
M is the midpoint of PQ and N is the midpoint of OR.
(a) Find the vector in terms of a and b.
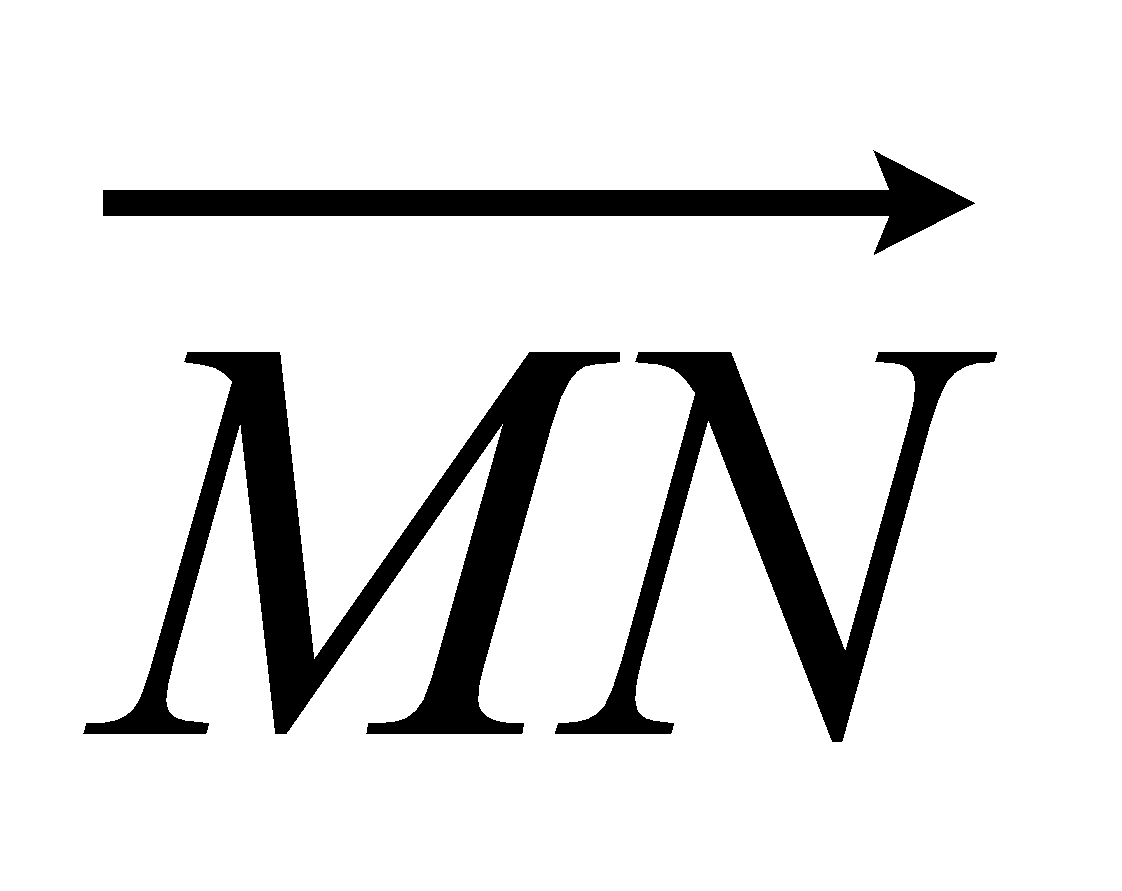
X is the midpoint of MN and Y is the midpoint of QR.
(b) Prove that XY is parallel to OR.

4. (a)Express in terms of a and/orb
(i)   
(ii) 
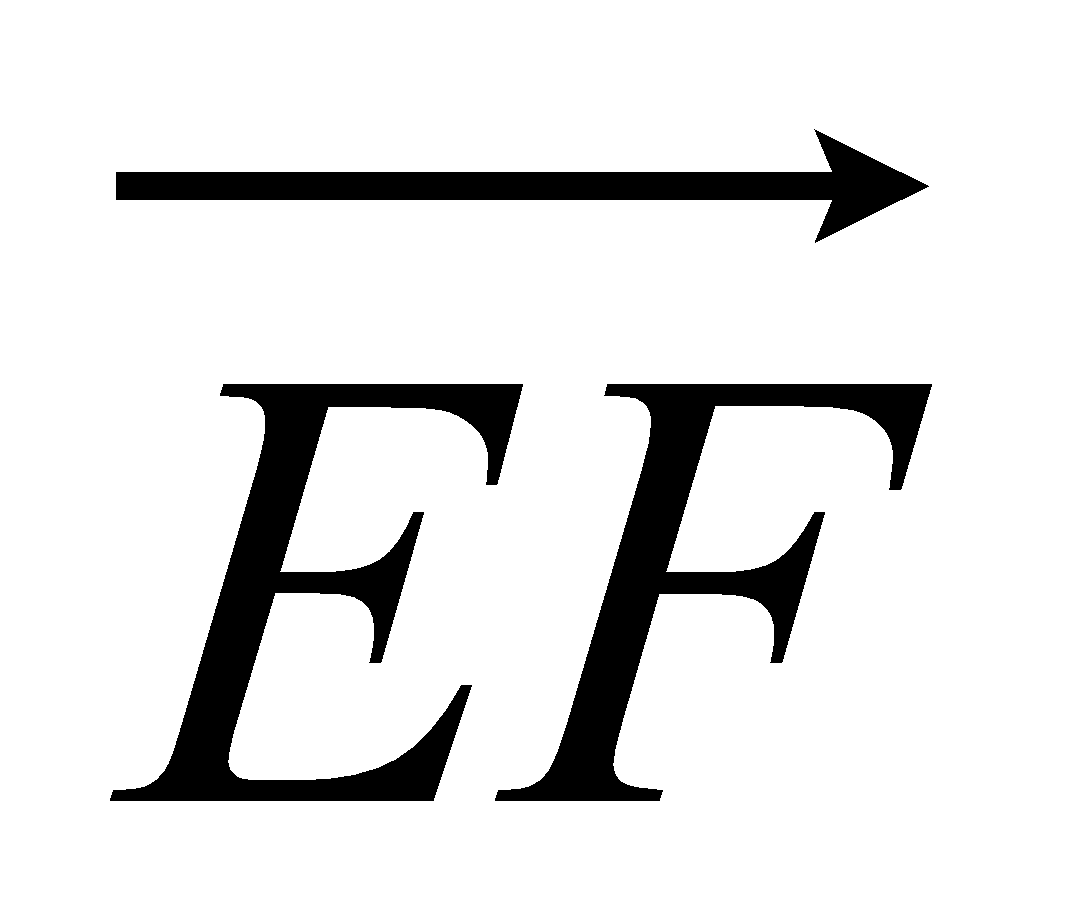
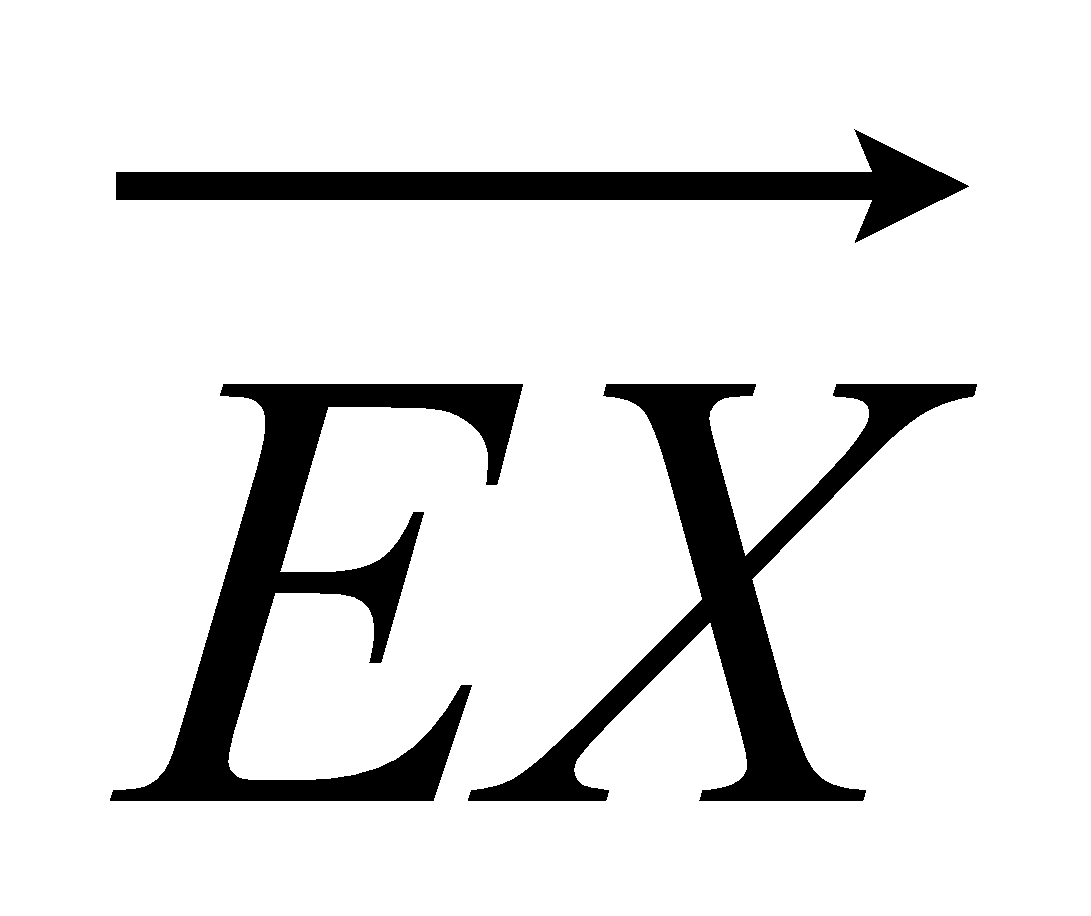
 X is the midpoint of BC.
(b) Express in terms of a and/or b
1 comment
1 comments
Read More

IGCSE CIE Mathematics Revision Sheet - 1


                                                                                    Marks: 48
Answer the following
1.
 
(a) (i) Draw the reflection of triangle T in the line x = 0. [2]
(ii) Draw the rotation of triangle T about (–2, –1) through 90° clockwise. [2]

(b) Describe fully the single transformation that maps triangle T onto triangle U. [2]

2.  


        [3]

         b)
        
                                [3]

3. 
(a) Solve the equation f(x) = g(1)      [2]

(b) Find f -1(x).        [2]

(c) Find gf(x) in its simplest form.     [3]

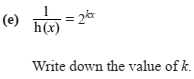
(d) Solve the equation h-1(x) = 0.5    [1]

  [1]

4.


AB is parallel to DC.
AB = 55 m, BD = 70 m, angle ABD = 40° and angle BCD = 32°.
(a) Calculate AD                  [4]

(b) Calculate BC.                  [4]

(c) Calculate the area of ABCD.      [3]

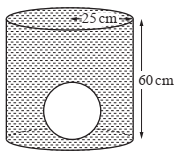
5. (i) Show that the volume of a metal sphere of radius 15 cm is 14 140 cm3, correct to 4 s.f                                                                             [2]
   

(ii)Calculate the volume of water needed to fill the tank     [3]

(iii) The sphere is removed from the tank. Calculate the depth, d, of water in the tank.    [2]


6.
[6]
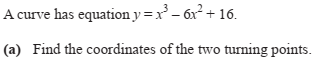
(b) Determine whether each of the turning points is a maximum or a minimum.
Give reasons for your answers.     [3]
Leave your comment
0 comments
Read More

IGCSE Mathematics Worksheet - Ratio & Proportion-2


Answer the following

1. Melissa is 13 years old. Becky is 12 years old. Daniel is 10 years old. Melissa, Becky and Daniel share £28 in the ratio of their ages. Becky gives a third of her share to her mother. How much should Becky now have?

2. Ann and Bob shared £240 in the ratio 3 : 5 Ann gave a half of her share to Colin. Bob gave a tenth of his share to Colin. What fraction of the £240 did Colin receive?

3. Peter won £75 as a prize. He gave 4/5 of the prize money as a present to Roger and Bethan. Roger and Bethan shared the present in the ratio 2:3 Work out how much they each got.

4. A shop sells CDs and DVDs. In one week the number of CDs sold and the number of DVDs sold were in the ratio 3:5 The total number of CDs and DVDs sold in the week was 728 Work out the number of CDs sold.

5. Rosa prepares the ingredients for pizzas. She uses cheese,topping and dough in the ratio 2 : 3 : 5 Rose uses 70 grams of dough. Work out the number of grams of cheese and the number of grams of topping Rosa uses.

6. Last year Kerry’s take home pay was £15 000 She spent 40% of her take home pay on rent. She used the rest of her take home pay for living expenses, clothes and entertainment in the ratio 3 : 1 : 2 How much did Kerry spend on entertainment last year?

7. Fred has a recipe for 30 biscuits. Here is a list of ingredients for 30 biscuits.

Self-raising flour : 230 g

Butter : 150 g

Caster sugar : 100 g

Eggs : 2


Fred wants to make 45 biscuits.

(a) Complete his new list of ingredients for 45 biscuits

Gill has only 1 kilogram of self-raising flour. She has plenty of the other ingredients.

(b) Work out the maximum number of biscuits that Gill could bake.

8. 4 men can build a shed in 20 hours. Calculate how long the same shed would take to build:
(a) if there was 1 man
(b) if there were 5 men.

9. The yield of wheat from 8 hectares of land is 360 quintals. Find the number of hectares of land required for a yield of 540 quintals?

10. 3 gallons of paint cover 900 square feet. How many gallons will cover 300 square feet?

Leave your comment
0 comments
Read More

IGCSE Mathematics Worksheet - Data Handling & Statistics-2


Answer the following

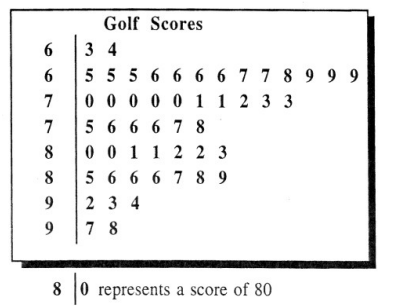
  1. The stem and leaf diagram shows a sample of 50 scores in a boy’s golf tournament.
    
a) Write down the median golf score.

b) Calculate the interquartile range & semi-interquartile range for these scores

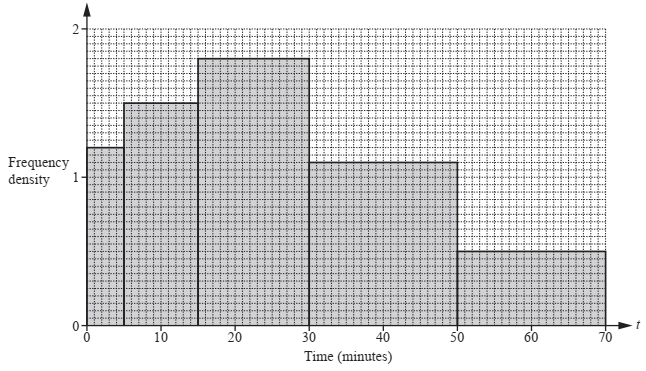
    2. The histogram shows information about the time, t minutes, spent in a shop by each of 80 people.

      Complete the frequency table
   

    3. The time taken for each of 120 students to complete a cooking challenge is shown in the table.
   

(i) Write down the modal time interval.

(ii) Calculate an estimate of the mean time.

(iii)Complete the cumulative frequency table.


(iv)On the grid, draw a cumulative frequency diagram to show this information.


(v) Find the median time. ......................................... min
(vi) Find the interquartile range. ......................................... min
(vii) Find the number of students who took more than 37 minutes to complete the cooking challenge
Downloaded from https://qusaistuition.blogspot.com
Leave your comment
0 comments
Read More

Latest Posts


Recent Comments

Copyright © Qusais Tuition