Answer the following
1.
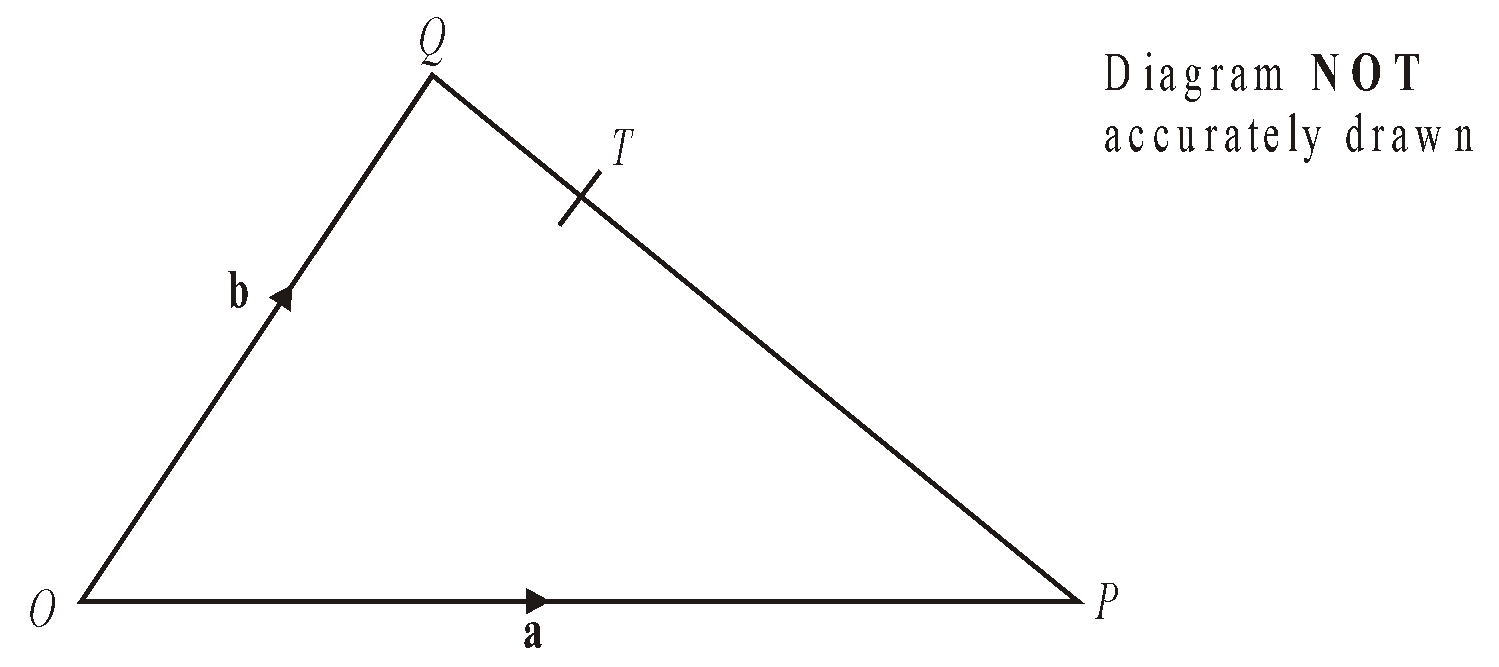
OPQ is a triangle. T is the point on PQ for which PT : TQ = 2 : 1.
 = a and
  = b.
= b.
(a) Write down, in terms of a and b, an expression for  .
.
(b) Express  in terms of a and b. Give your answer in its simplest form.
2.
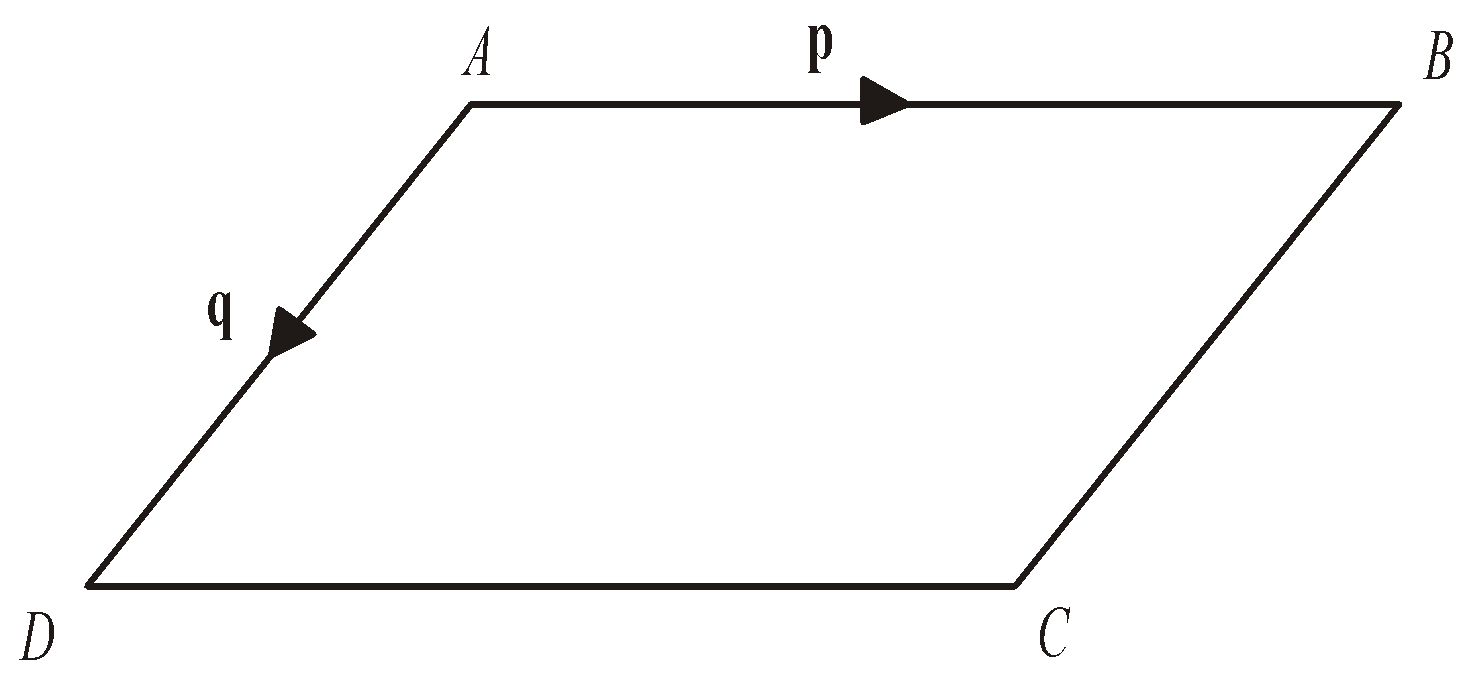
ABCD is a parallelogram. AB is parallel to DC. AD is parallel to BC.  = p
= p  = q
= q
Express, in terms of p and q
(i) 
(ii) 
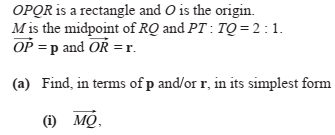
3.
M is the midpoint of PQ and N is the midpoint of OR.
(a) Find the vector  in terms of a and b.
X is the midpoint of MN and Y is the midpoint of QR.
(b) Prove that XY is parallel to OR.
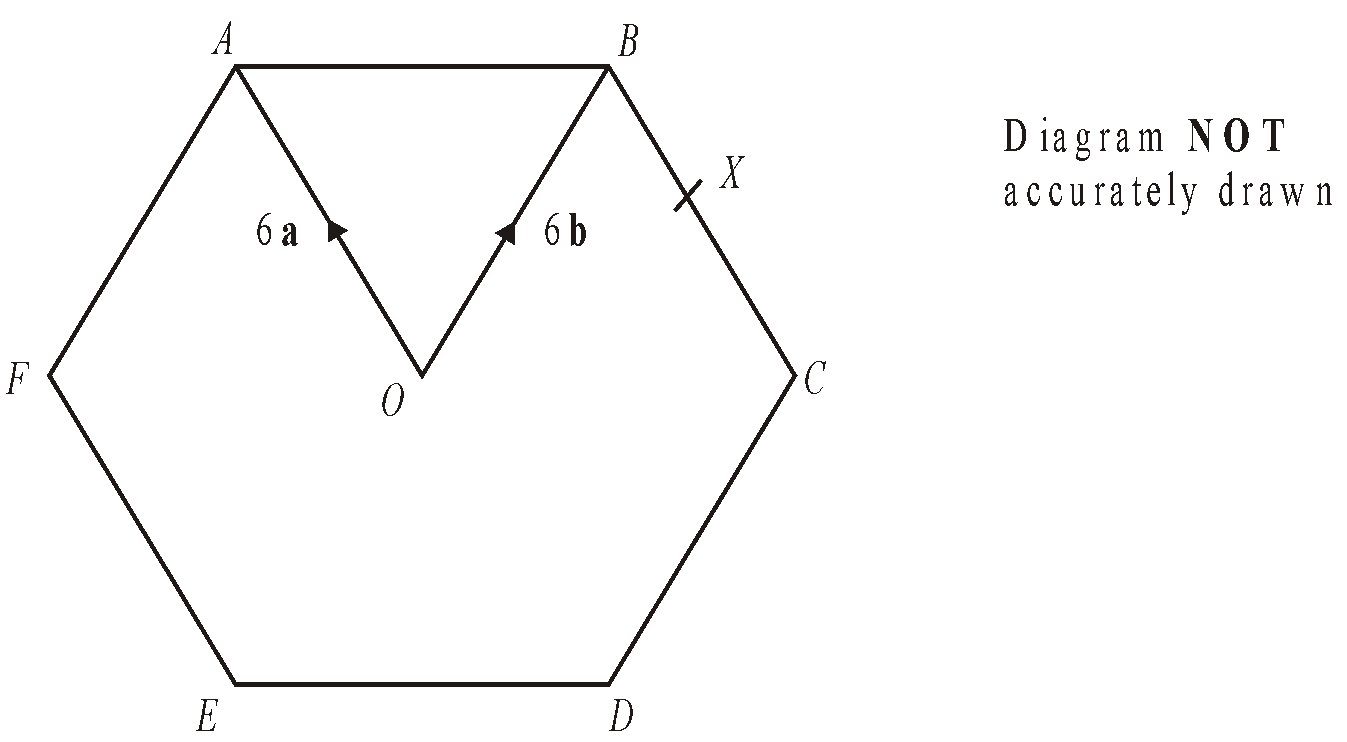
4. (a)Express in terms of a and/orb
(i) 
(ii)
X is the midpoint of BC.
(b) Express  in terms of a and/or b


 [3]
[3] [3]
[3]